2012 Solar Power
33% More Solar Power in Early 2012
Green Basics Advanced Green Steps Speaking Green Success Stories
Green Basics Advanced Green Steps Speaking Green Success Stories
Solar energy production is higher at the start of 2012 compared to the same timeframe in 2011. These are sample solar PV installations in Ontario which show some solar power production variability based on location.
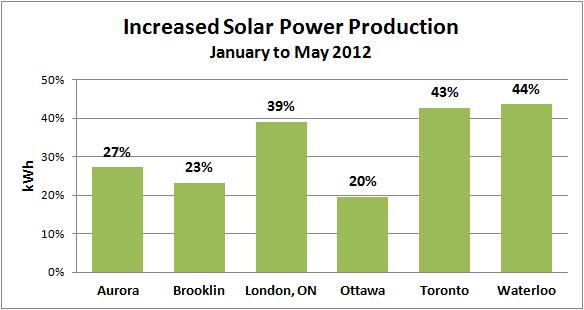 Solar power increase from 2011 to 2012 during January to May
| Solar Installation | 2011 kWh | 2012 kWh | Increase |
|---|---|---|---|
| Aurora, Ontario | 653 | 831 | 27% |
| Brooklin, Ontario | 1,872 | 2,307 | 23% |
| London, Ontario | 1,086 | 1,510 | 39% |
| Ottawa, Ontario | 2,797 | 3,346 | 20% |
| Toronto, Ontario | 1,867 | 2,666 | 43% |
| Waterloo, Ontario | 3,392 | 4,875 | 44% |
| Average | 33% |
For solar power data on more locations, see solar power examples.

